Table of Contents
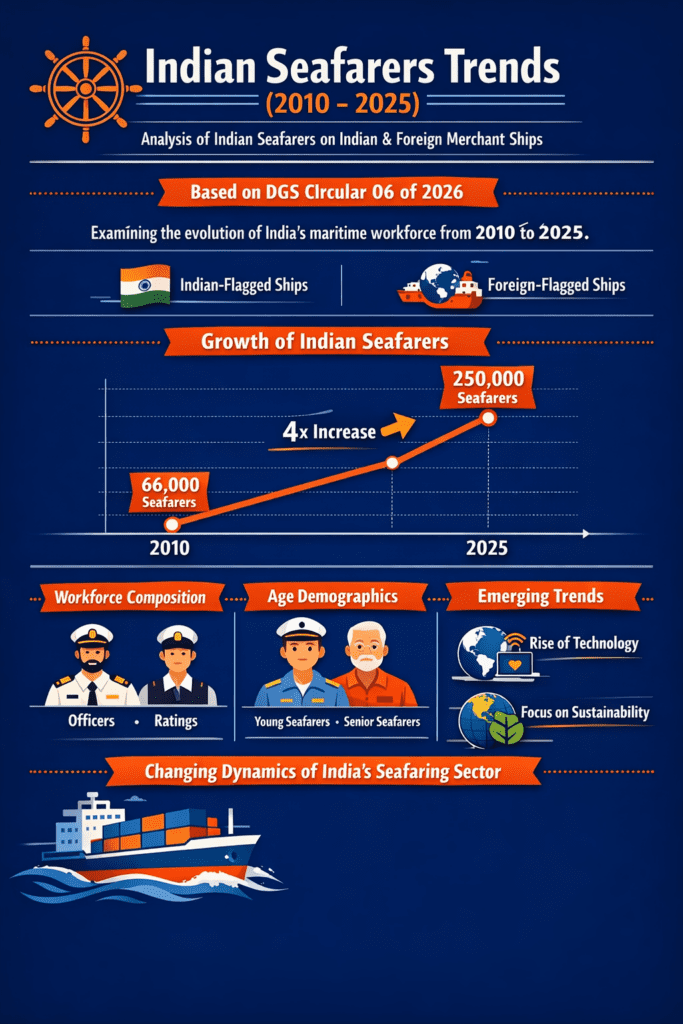
India has long been one of the world’s largest suppliers of maritime manpower. To understand how this workforce has evolved over time, the Directorate General of Shipping (DGS) issued Circular 06 of 2026, presenting official statistics on the engagement of Indian seafarers on Indian-flag and foreign-flag merchant ships from 2010 to 2025.
This blog analyses that data to highlight long-term trends, workforce composition, and emerging shifts in India’s seafaring landscape.
Overview of the DGS Circular
The data published under DGS Circular 06 of 2026 captures year-wise engagement details of Indian seafarers across:
- Nautical and engineering streams
- Ratings and officers
- Rank-wise classifications
- Male and female seafarers
- Employment on Indian and foreign flag vessels (combined)
The circular offers a peek into recruitment trends in the maritime sector and overall scenario of growth in the Indian shipping sector.
Growth of Indian Seafarer Engagement
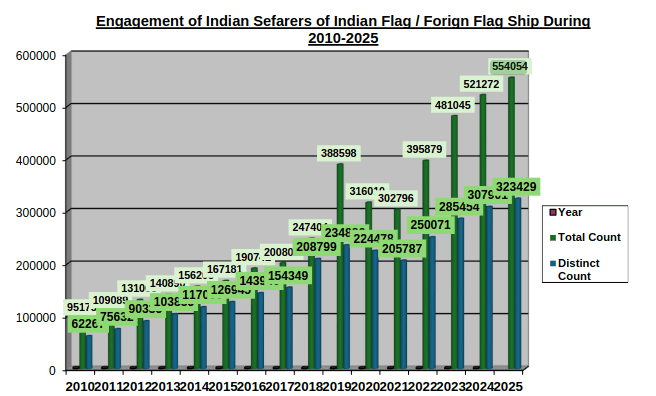
Between 2010 and 2025, the engagement of Indian seafarers shows a clear upward trajectory.
In 2010, total seafarer engagement stood at 95,175. By 2025, this figure had risen sharply to 5,54,054. Alongside this, the number of distinct seafarers, representing individual Indian nationals who sailed during the year, increased from 62,267 in 2010 to 3,23,429 in 2025.
The data reflects three distinct phases. A period of steady growth from 2010 to 2017 is followed by a sharp expansion in 2018 and 2019. The years 2020 and 2021 show a temporary contraction, aligning with global shipping disruptions. From 2022 onwards, the figures rebound strongly, reaching their highest levels by 2025.
This long-term increase highlights India’s expanding role in supplying trained maritime professionals to the global shipping industry.
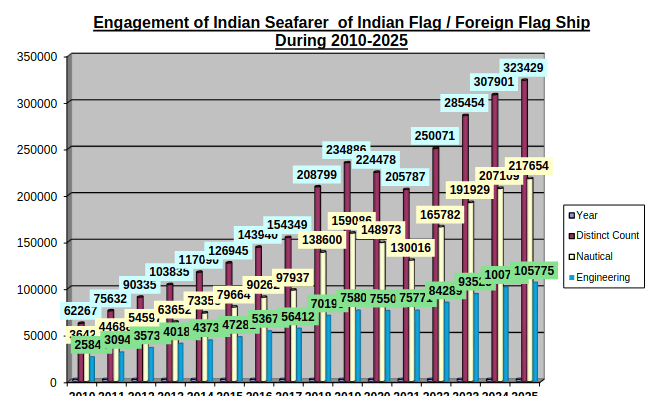
Nautical and Engineering Workforce Trends
The circular divides seafarers into nautical (deck) and engineering (engine) streams.
By 2025, the number of distinct nautical seafarers reached 2,17,654, while engineering seafarers stood at 1,05,775. Although the nautical stream remains larger, both segments demonstrate consistent growth over the 16-year period.
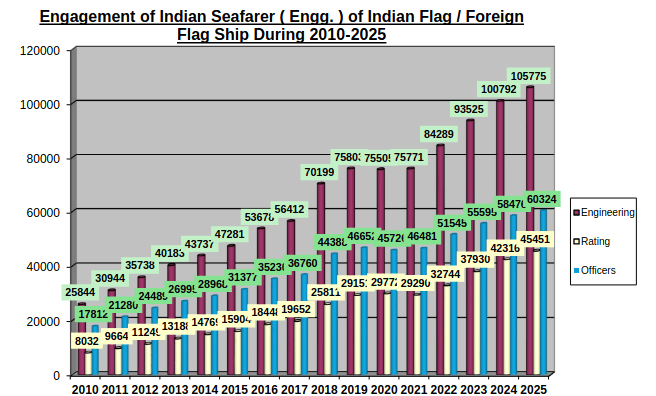
Engineering roles, particularly officer-level positions, show strong and steady expansion, indicating sustained demand for technically qualified personnel. This balanced growth across deck and engine departments is essential for maintaining operational efficiency and compliance on board merchant vessels.
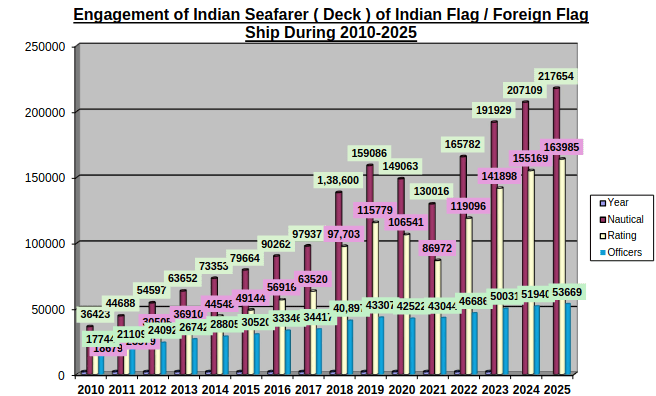
Ratings and Officers: Workforce Composition
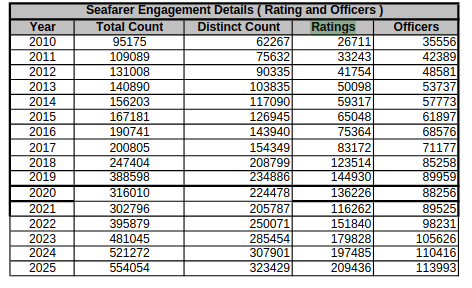
Another important dimension of the data is the split between ratings and officers.
Ratings continue to form the majority of India’s seafaring workforce. The number of distinct ratings increased significantly from 26,711 in 2010 to 2,09,436 in 2025. Officers also saw steady growth, rising from 35,556 in 2010 to 1,13,993 in 2025.
This distribution reflects India’s strength in supplying both operational crew and certified officers, supporting vessels across all levels of shipboard hierarchy.
Rank-Wise and Role-Specific Developments
The circular provides detailed rank-wise data covering a wide range of shipboard roles.
Among nautical ratings, consistent growth is visible in roles such as Deck Watchkeeping Rating, Able Seaman, Bosun, and Trainee Deck Rating. Nautical officer ranks including Master, Chief Officer, Second Officer, and Officer in Charge of a Navigational Watch (OICNW), also show steady increases over time.
On the engineering side, strong growth is observed in Engine Petty Officers, Motormen, Oilers, and Electro-Technical Ratings. Officer ranks such as Chief Engineer, Second Engineer, Third Engineer, and Electro-Technical Officer expand consistently throughout the period.
One notable trend is the sharp rise in cruise vessel employees and hospitality-related roles after 2017, reflecting changes in global shipping and passenger vessel demand.
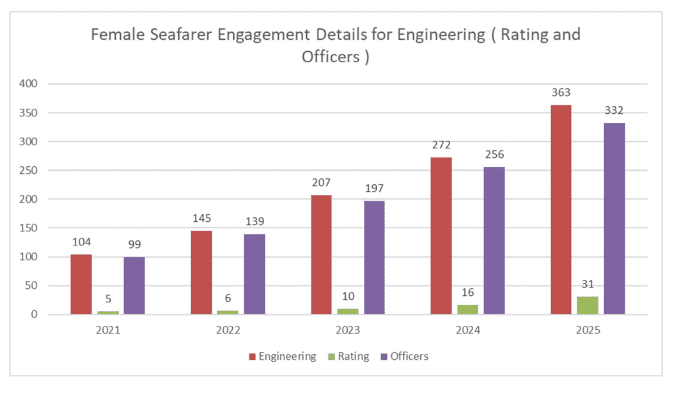
Female Participation in Indian Seafaring
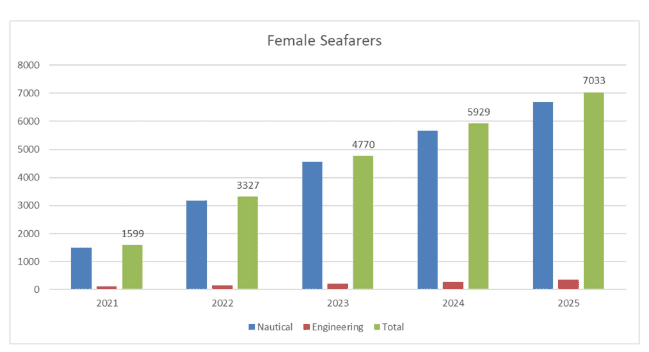
A significant inclusion in the circular is the data on female seafarer engagement, available from 2021 onwards.
In 2021, the number of distinct female seafarers was approximately 1,600. By 2025, this figure had increased to over 7,000. The data shows female participation across both nautical and engineering streams, and in both rating and officer categories.
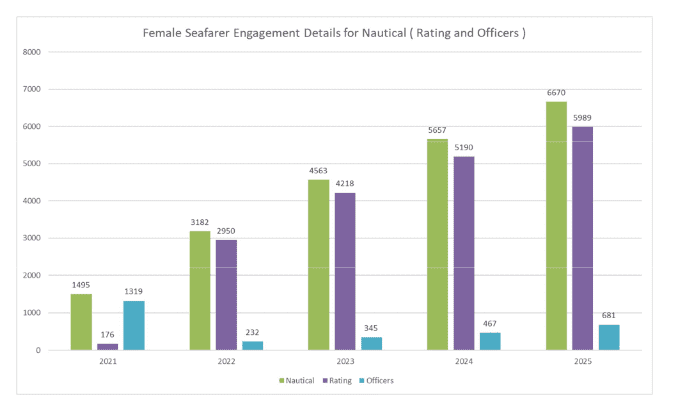
While women still represent a small share of the overall workforce, the consistent year-on-year growth indicates gradual progress towards greater gender diversity in Indian seafaring.
Indian and Foreign Flag Employment
The engagement figures in the circular combine employment on Indian-flag and foreign-flag merchant ships. Although the data does not segregate the two categories, the scale of engagement clearly reflects India’s continued importance as a global maritime manpower hub, supplying seafarers to fleets operating worldwide.
What This Data Indicates for the Maritime Sector
The long-term trends presented in DGS Circular 06 of 2026 underline several key points. India’s seafarer base has expanded significantly over the past decade and a half, with resilience demonstrated even during periods of global disruption. Growth across officer and rating levels, along with increasing technical specialisation and female participation, points to a maturing maritime workforce.
For ship owners, RPSL agencies, training institutes, MTO Companies, and policymakers, this data provides a valuable reference for workforce planning, capacity building, and long-term strategy.
What the Future Holds for the Indian Shipping and Seafaring Sector
While DGS Circular 06 of 2026 is retrospective in nature, the long-term trends it captures provide strong indicators of where the Indian shipping and seafaring ecosystem is heading.
The sustained increase in seafarer engagement over a 16-year period suggests that global reliance on Indian maritime manpower is likely to continue. Even after the disruption seen during 2020–2021, the sharp recovery from 2022 onwards indicates resilience and adaptability within the industry. This positions India favourably as international shipping activity stabilises and expands.
The steady growth in officer numbers, particularly in technical and specialised roles such as Electro-Technical Officers and Engineering Officers, points to an increasing demand for higher-skilled maritime professionals. As ships become more technologically advanced and compliance requirements more stringent, the need for well-trained officers is expected to grow further.
Another important signal is the rise in cruise vessel and hospitality-related roles. This trend indicates diversification beyond traditional cargo shipping, with passenger vessels and specialised maritime services creating new employment avenues for Indian seafarers.
Female participation, though still relatively small in absolute terms, shows consistent year-on-year growth. This suggests that the future workforce may become more diverse, supported by evolving industry practices, improved onboard facilities, and targeted training initiatives.
Overall, the data reflects a future where India’s shipping industry is likely to be characterised by a larger, more skilled, and more diversified seafarer workforce. Continued investment in maritime training, certification quality, and regulatory oversight will be critical to sustaining this growth and maintaining India’s standing as a trusted global source of maritime professionals.
Conclusion
DGS Circular 06 of 2026 offers one of the most comprehensive statistical snapshots of Indian seafarer engagement to date. Covering 16 years of official data, it confirms India’s position as a leading supplier of skilled maritime professionals to the global shipping industry.
As international trade and shipping continue to evolve, such data-driven insights will play a crucial role in shaping the future of India’s maritime human capital.
FAQ’s on DGS Circular 06 of 2026
1. What is DGS Circular 06 of 2026 about?
DGS Circular 06 of 2026 publishes official statistics on the engagement of Indian seafarers on Indian-flag and foreign-flag merchant ships from 2010 to 2025, based on data from the Directorate General of Shipping’s e-governance system.
2. What period does the seafarer data cover?
The circular covers a 16-year period, from 2010 to 2025, allowing long-term analysis of trends in Indian seafarer employment and workforce growth.
3. What is the difference between total count and distinct count in the data?
Total count represents the number of engagements during a year, while distinct count refers to the number of individual seafarers engaged, avoiding duplication where a seafarer sailed multiple times in the same year.
4. Does the data include both Indian-flag and foreign-flag ships?
Yes, the engagement figures combine employment on both Indian-flag and foreign-flag merchant vessels. The circular does not provide a separate breakup by flag.
5. Which categories of seafarers are included in the statistics?
The data includes nautical and engineering seafarers, ratings and officers, and provides detailed rank-wise classifications across deck, engine, and specialised roles.
6. How has Indian seafarer engagement changed over time?
The data shows steady growth from 2010, a sharp increase after 2018, a temporary dip during 2020–2021, and a strong recovery from 2022 to 2025, reaching the highest recorded engagement levels.
7. Are female seafarers included in the DGS statistics?
Yes, the circular includes separate statistics for female seafarers from 2021 onwards, covering both nautical and engineering streams and both ratings and officers.
8. Which segment is larger – ratings or officers?
Ratings form the larger portion of the Indian seafaring workforce, though officer numbers have also grown steadily over the years, particularly in technical and engineering roles.
9. Does the circular provide rank-wise seafarer details?
Yes, the data includes detailed year-wise figures for a wide range of ranks, such as Masters, Engineers, Deck Officers, Ratings, Electro-Technical Officers, and cruise vessel staff.
10. How can this data be useful for maritime stakeholders?
The statistics can be used by ship owners, manning agencies, training institutes, and policymakers for workforce planning, capacity assessment, trend analysis, and understanding the long-term evolution of India’s seafaring sector.